
Logging, metrics, and tracing
Logging
Capture Gateway standard output/error and Receiver logs with instance, release, module, and runtime labels. Log startup discovery and publication separately from invocation failures.
GG_DEBUG=1 or TRUE logs incoming and outgoing byte traffic. Use it only for controlled diagnosis;
payload bytes can expose sensitive data and increase log volume.
Tracing
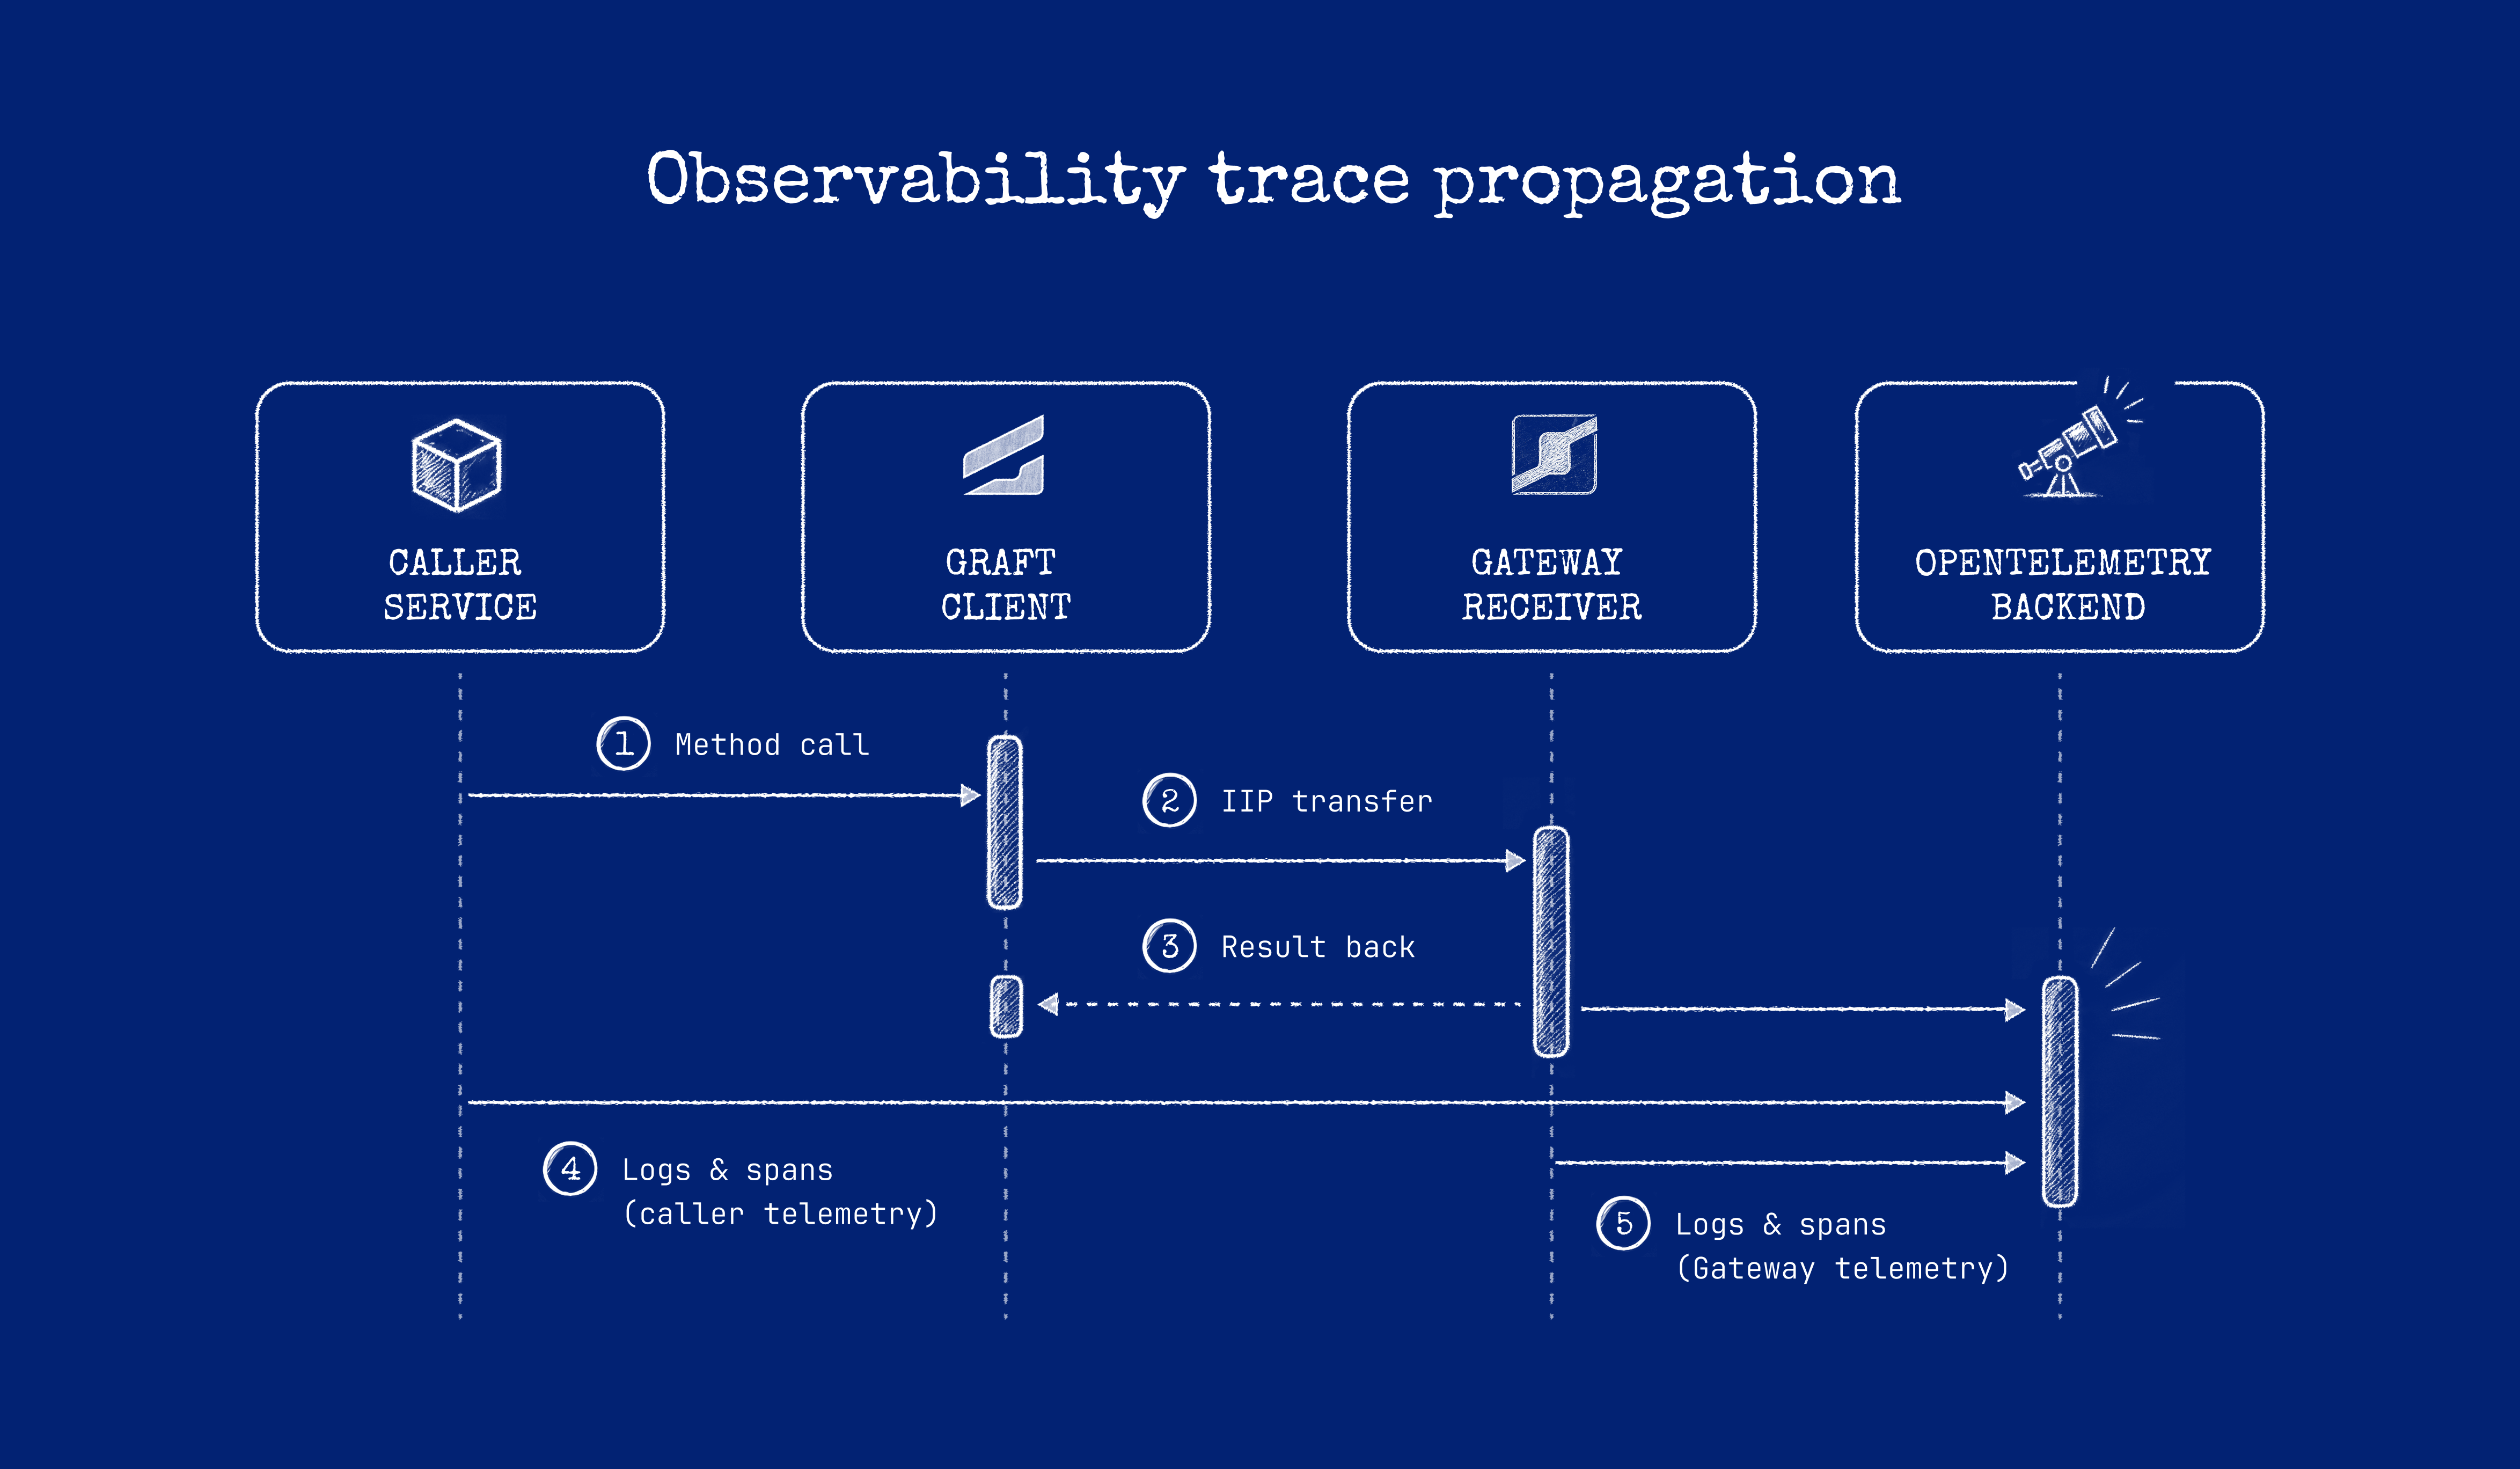
Graftcode propagates W3C Trace Context (traceparent) across a Graft call on .NET and Node.js, so
a single remote call joins the Caller's trace instead of starting a new one. Other runtimes are not
guaranteed to propagate context; verify before relying on it.
Trace export is an application or platform responsibility. Instrument the Caller and Receiver with their normal OpenTelemetry setup and exporter; Gateway does not provide a built-in collector.
End-to-end trace example (.NET or Node.js)
- Configure OpenTelemetry in the Caller with your exporter (for example OTLP to your backend), and start a span around the operation that calls the Graft.
- Call the Graft normally. The generated call runs inside the active span; Graftcode adds
traceparentto the outgoing invocation. - Configure OpenTelemetry in the Receiver with the same trace-context propagator and an exporter. The Receiver continues the same trace rather than starting a new one.
- Export to one backend. In the trace you should see the Caller span, the runtime hop, and the Receiver span (plus any nested Graft calls) under one trace ID:
trace 4bf92f3577b34da6...
  └─ Caller span: CalculateMonthlyBill (client)
       └─ Receiver span: BillingService.CalculateMonthlyBill (server)
            └─ Receiver span: repository.load (internal)
Record errors on the active span in the Receiver so failures appear on the same trace. Nested Graft calls from the Receiver continue propagating context on the supported runtimes.
Metrics
Record at the caller/Receiver boundary:
- call count and failures by stable operation name;
- duration distributions;
- active/failed connections;
- process CPU, memory, restarts, and instance count;
- dependency timeout/retry counts.
Avoid IDs, argument values, and unbounded exception text as metric labels.
Gateway does not expose a built-in Prometheus/OpenMetrics endpoint or a metric catalog. Instrument your applications and infrastructure to collect metrics.